Market Outlook
May 05, 2017
Market Cues
Domestic Indices
Chg (%)
(Pts)
(Close)
Indian markets are likely to trade in negative zone tracking the SGX Nifty & Asian
BSE Sensex
0.8
231
30,126
markets.
Nifty
0.5
48
9,360
Extending the lackluster performance seen over the past several sessions, US
Mid Cap
0.5
71
14,881
markets showed a lack of direction throughout the trading day on Thursday. The
Small Cap
0.4
155
15,486
major averages spent the day bouncing back and forth across the unchanged line.
The choppy trading on Wall Street came as traders looked ahead to the release of
Bankex
2.3
585
25,831
the Labor Departments closely watched monthly jobs report on Friday.
The European markets ended Thursdays session in the green. Investors reacted
Global Indices
Chg (%)
(Pts)
(Close)
positively to the latest batch of corporate earnings reports, particularly the numbers
Dow Jones
(0.0)
1(6)
20,951
from HSBC, Adidas and Royal Dutch Shell. Economic data also contributed to the
Nasdaq
0.0
53
6,075
upbeat mood, as the euro zone private sector expanded at the fastest pace in six
FTSE
0.2
14
7,248
years in April.
Nikkei
(00.7
135
19,446
Indian shares rose notably on Thursday, with banks rallying as ICICI Bank reported
Hang Seng
(0.0)
(12)
24,684
an almost threefold increase in March quarter net profit and the Union Cabinet
Shanghai Com
(0.3)
(8)
3,127
approved promulgation of an ordinance to amend the Banking Regulation Act to
deal with the problem of bad loans.
Advances / Declines
BSE
NSE
Result Review
Advances
1,436
1,863
Exide Industries Q4 net profit falls 6% even as total income up by 11.3%
Declines
1,440
825
Detailed analysis on Pg2
Unchanged
146
77
Investor’s Ready Reckoner
Key Domestic & Global Indicators
Volumes (` Cr)
Stock Watch: Latest investment recommendations on 150+ stocks
BSE
4,462
Refer Pg6 onwards
NSE
27,632
Top Picks
#Net Inflows (` Cr)
Net
Mtd
Ytd
CMP
Target
Upside
Company
Sector
Rating
(`)
(`)
(%)
FII
(56(93)
(2(427)
41,585
Blue Star
Capital Goods
Accumulate
680
760
11.7
MFs
8258
9,918
19,355
Dewan Housing Fin. Financials
Buy
438
520
18.7
Mahindra Lifespace Real Estate
Accumulate
481
522
8.5
Navkar Corporation Others
Buy
214
265
23.9
Top Gainers
Price (`)
Chg (%)
KEI Industries
Capital Goods
Accumulate
215
239
10.7
Icicibank
298
9.2
More Top Picks on Pg4
Iob
31
8.3
Coromandel
398
7.3
Key Upcoming Events
Previous
Consensus
Unionbank
190
6.4
Date
Region
Event Description
Reading
Expectations
Gsfc
142
6.4
May 05, 2017 US
Unnemployment rate
4.50
4.60
May 05, 2017 US
Change in Nonfarm payrolls
98.00
190.00
May 08, 2017 China
Exports YoY%
16.40
12.00
Top Losers
Price (`)
Chg (%)
May 05, 2017 India
Exports YoY%
27.60
Intellect
132
(5.0)
May 10, 2017 China
Consumer Price Index (YoY)
0.90
1.10
Religare
192
(4.8)
May 10, 2017 India
Imports YoY%
45.30
Hathway
42
(4.2)
More Events on Pg5
Fsl
42
(3.4)
Cyient
527
(3.2)
#As on May 04, 2017
Market Outlook
May 05, 2017
News Analysis
Exide Industries Q4 net profit falls 6% even as total income up by
11.3%
Rising lead prices continued to stress both the topline as well as the bottomline of
Exide Industries as it reported a six per cent fall in its net profit at `164.8Cr for the
quarter ended March 31, 2017, even as its total income rose by 11.36%.
In the same period of the financial year 2015-16, the company's revenue stood at
`1998.4Cr backed by a net profit of `175.2Cr.
The revenue surge failed to translate into a higher bottomline during Q4 as its cost
of materials consumed surged by 17% at `1293.2Cr, from the year-ago period's
material consumption cost of `1105.1Ct.
Economic and Political News
India needs to address IPR, tax issues for ease of doing biz: US diplomat
Banking Regulation Act: President likely to promulgate ordinance tomorrow
Odisha gets 28 technical bids for two iron ore blocks
Haryana Assembly passes GST Bill
Chinese investors eye opportunities in real estate sector in India
Rera Act: 14 more states in process to notify the law
Corporate News
Indian IT infra spending to see tepid growth this year: Gartner.
Essar Steel to supply Posco over 1-mn-tonne flat steel products.
General Motors to consider fresh VRS applications at Halol facility.
Emami Ltd Q4 net declines marginally at `68.65Cr.
Market Outlook
May 05, 2017
Quarterly Bloomberg Brokers Consensus Estimate
Eicher Motors Consol - May 5, 2017
Particulars ( ` cr)
4QFY17E
4QFY16
y-o-y (%)
3QFY17
q-o-q (%)
Net sales
1,894
3,702
(48.8)
1,828
3.6
EBITDA
604
640
(5.7)
577
4.6
EBITDA margin (%)
31.9
17.3
31.6
Net profit
451
382
18.1
415
8.7
Bharti Infratel Consol - May 8, 2017
Particulars ( ` cr)
4QFY17E
4QFY16
y-o-y (%)
3QFY17
q-o-q (%)
Net sales
3,486
3,162
10.3
1,530
127.8
EBITDA
1,540
1,425
8.1
706
118.3
EBITDA margin (%)
44.2
45.1
46.1
Net profit
700
662
5.8
620
12.9
ABB India Ltd - May 8, 2017
Particulars ( ` cr)
1QCY17E
1QCY16
y-o-y (%)
4QCY16
q-o-q (%)
Net sales
2,224
1,976
12.5
2,441
(8.9)
EBITDA
195
149
30.5
282
(31.0)
EBITDA margin (%)
8.7
7.5
11.5
Net profit
92
71
29.8
147
(37.3)
Godrej Consumer Products Ltd Consol - May 9, 2017
Particulars ( ` cr)
4QFY17E
4QFY16
y-o-y (%)
3QFY17
q-o-q (%)
Net sales
2,496
2,266
10.1
2,392
4.3
EBITDA
512
444
15.5
517
(0.9)
EBITDA margin (%)
20.5
19.6
21.6
Net profit
357
310
15.2
354
1.0
Bharti Airtel Ltd Consol - May 9, 2017
Particulars ( ` cr)
4QFY17E
4QFY16
y-o-y (%)
3QFY17
q-o-q (%)
Net sales
22,421
24,960
(10.2)
23,336
(3.9)
EBITDA
7,742
9,136
(15.3)
8,510
(9.0)
EBITDA margin (%)
34.5
36.6
36.5
Net profit
508
1,590
(68.1)
636
(20.2)
Zee Entertainment Enterprises Ltd Consol - May 10, 2017
Particulars ( ` cr)
4QFY17E
4QFY16
y-o-y (%)
3QFY17
q-o-q (%)
Net sales
1,547
1,532
1.0
1,639
(5.7)
EBITDA
443
414
7.2
516
(14.1)
EBITDA margin (%)
28.7
27.0
31.5
Net profit
308
261
18.4
251
23.0
Market Outlook
May 05, 2017
Top Picks ★★★★★
Market Cap
CMP
Target
Upside
Company
Rationale
(` Cr)
(`)
(`)
(%)
Strong growth in domestic business due to its leadership
in acute therapeutic segment. Alkem expects to launch
Alkem Laboratories
23,466
1,963
2,257
15.0
more products in USA, which bodes for its international
business.
We expect the company would report strong profitability
Asian Granito
1,152
383
405
5.8
owing to better product mix, higher B2C sales and
amalgamation synergy..
Favourable outlook for the AC industry to augur well for
Cooling products business which is out pacing the market
Blue Star
6,500
680
760
11.7
growth. EMPPAC division's profitability to improve once
operating environment turns around..
With a focus on the low and medium income (LMI)
consumer segment, the company has increased its
Dewan Housing Finance
13,716
438
520
18.7
presence in tier-II & III cities where the growth opportunity
is immense.
Strong loan growth backed by diversified loan portfolio
and adequate CAR. ROE & ROA likely to remain decent
Equitas Holdings
5,525
164
235
43.7
as risk of dilution remains low. Attractive valuations
considering growth.
Economic recovery to have favourable impact on
advertising & circulation revenue growth. Further, the
Jagran Prakashan
6,311
193
225
16.5
acquisition of a radio business (Radio City) would also
boost the company's revenue growth.
High order book execution in EPC segment, rising B2C
KEI Industries
1,675
215
239
10.7
sales and higher exports to boost the revenues and
profitability
Speedier execution and speedier sales, strong revenue
Mahindra Lifespace
1,976
481
522
8.5
visibilty in short-to-long run, attractive valuations
Massive capacity expansion along with rail advantage at
Navkar Corporation
3,050
214
265
23.9
ICD as well CFS augurs well for the company
Strong brands and distribution network would boost
Siyaram Silk Mills
1,612
1,720
1,872
8.8
growth going ahead. Stock currently trades at an
inexpensive valuation.
Market leadership in Hindi news genre and no.
2
viewership ranking in English news genre, exit from the
TV Today Network
1,573
264
344
30.4
radio business, and anticipated growth in ad spends by
corporates to benefit the stock.
Source: Company, Angel Research
Market Outlook
May 05, 2017
Key Upcoming Events
Result Calendar
Date
Company
May 05, 2017
Apollo Tyres, Visaka Industries, Aventis
May 06, 2017
L G Balakrishnan & Bros
May 08, 2017
ABB, Canara Bank, Union Bank
Source: Bloomberg, Angel Research
Global economic events release calendar
Bloomberg Data
Date
Time
Country
Event Description
Unit
Period
Last Reported
Estimated
6:00 PMUS
Unnemployment rate
%
Apr
4.50
4.60
May 05, 2017
6:00 PMUS
Change in Nonfarm payrolls
Thousands
Apr
98.00
190.00
May 08, 2017
China
Exports YoY%
% Change
Apr
16.40
12.00
May 10, 2017
India
Exports YoY%
% Change
Apr
27.60
7:00 AMChina
Consumer Price Index (YoY)
% Change
Apr
0.90
1.10
India
Imports YoY%
% Change
Apr
45.30
May 11, 2017
US
Producer Price Index (mom)
% Change
Apr
(0.20)
2:00 PMUK
Industrial Production (YoY)
% Change
Mar
2.80
4:30 PMUK
BOE Announces rates
% Ratio
May 11
0.25
May 12, 2017
5:30 PMIndia
Industrial Production YoY
% Change
Mar
(1.20)
6:00 PMUS
Consumer price index (mom)
% Change
Apr
(0.30)
0.30
11:30 AMGermany GDP nsa (YoY)
% Change 1Q P
1.20
May 15, 2017 12:00 PMIndia
Monthly Wholesale Prices YoY%
% Change
Apr
5.70
7:30 AMChina
Industrial Production (YoY)
% Change
Apr
7.60
7.00
May 16, 2017
2:30 PMEuro Zone Euro-Zone GDP s.a. (QoQ)
% Change 1Q P
0.50
Source: Bloomberg, Angel Research
Market Outlook
May 05, 2017
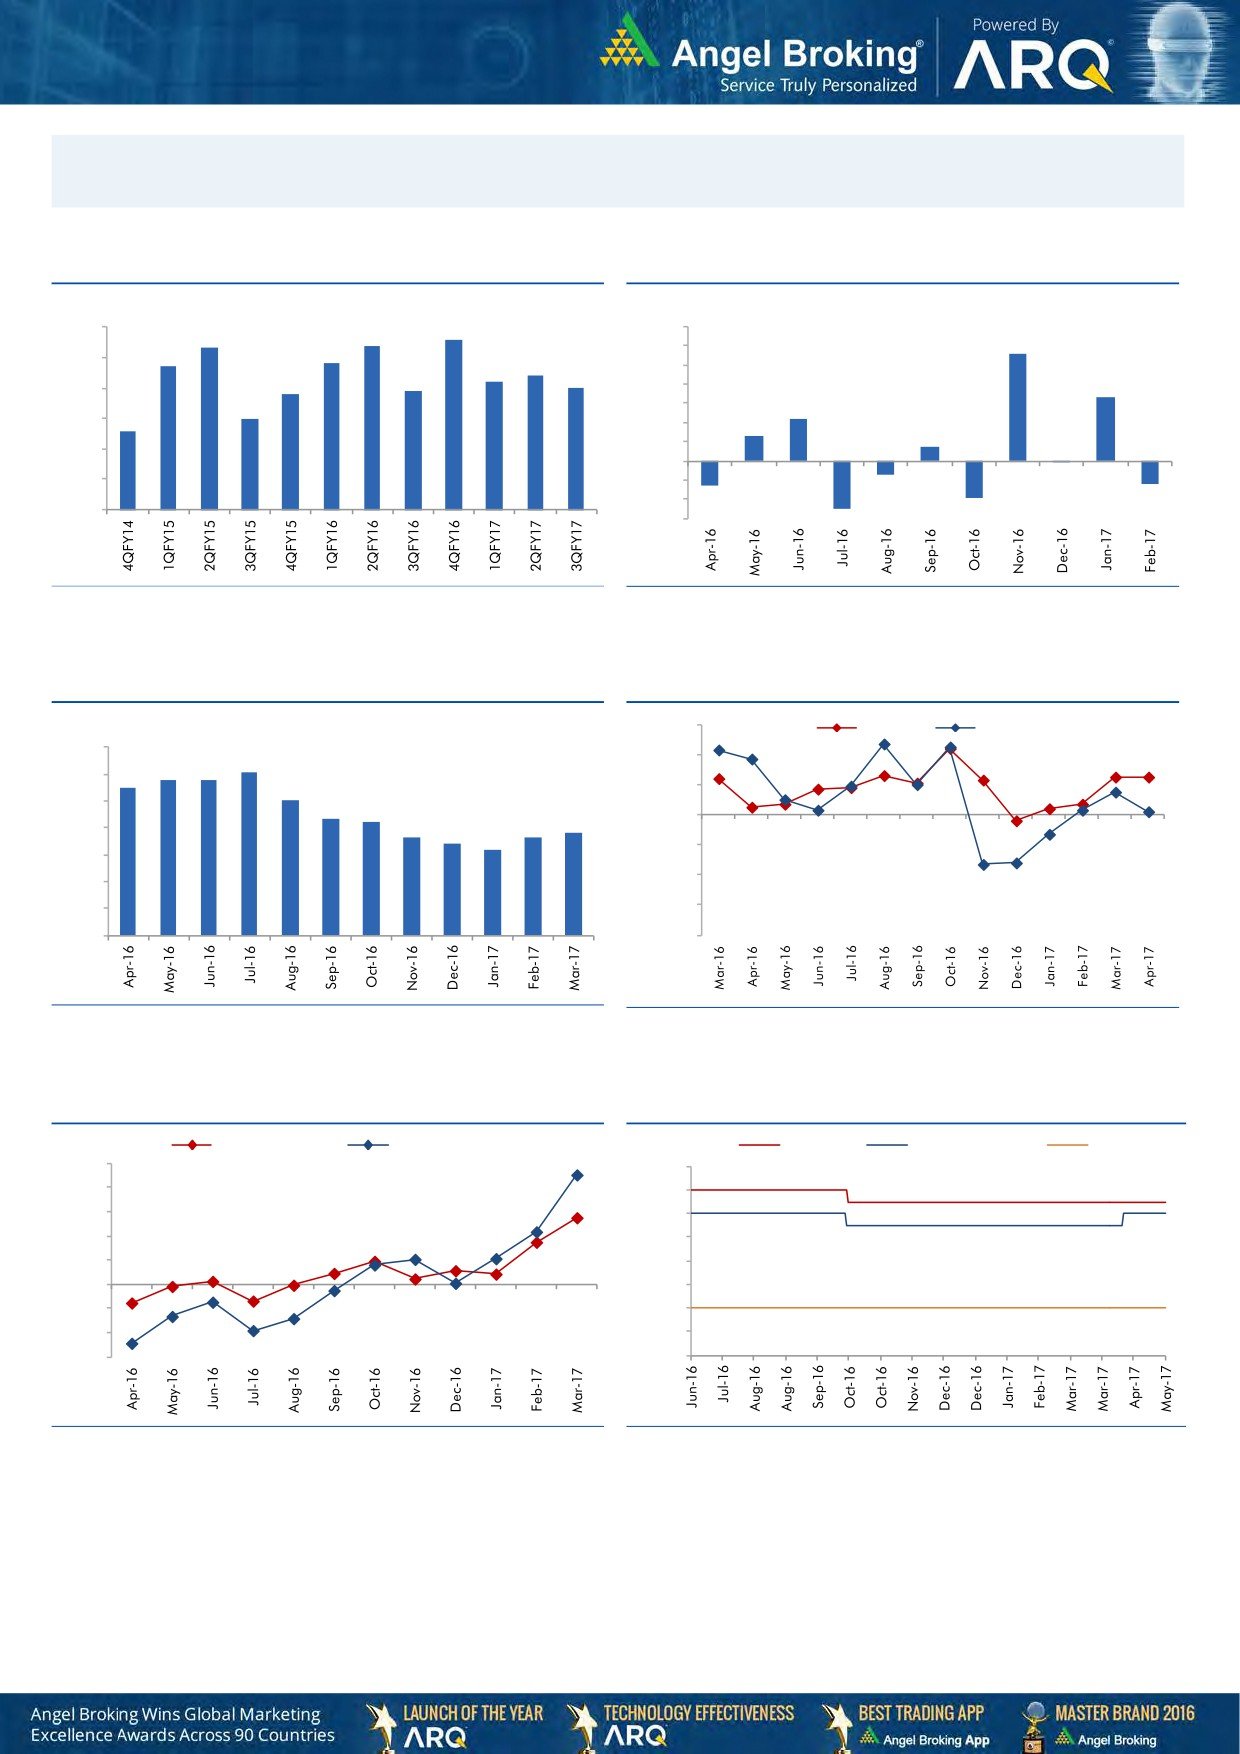
Macro watch
Exhibit 1: Quarterly GDP trends
Exhibit 2: IIP trends
(%)
(%)
8.6
9.0
8.3
8.4
7.0
5.6
7.7
7.8
6.0
8.0
7.4
7.2
5.0
6.9
7.0
6.8
3.3
7.0
4.0
6.0
3.0
2.2
5.6
6.0
2.0
1.3
0.7
1.0
5.0
-
4.0
(1.0)
(0.1)
(0.7)
(2.0)
(1.3)
(1.2)
3.0
(3.0)
(1.9)
(2.5)
Source: CSO, Angel Research
Source: MOSPI, Angel Research
Exhibit 3: Monthly CPI inflation trends
Exhibit 4: Manufacturing and services PMI
(%)
56.0
Mfg. PMI
Services PMI
7.0
6.1
54.0
5.8
5.8
6.0
5.5
5.1
52.0
5.0
4.3
4.2
3.7
3.8
50.0
4.0
3.6
3.4
3.2
48.0
3.0
46.0
2.0
1.0
44.0
-
42.0
Source: MOSPI, Angel Research
Source: Market, Angel Research; Note: Level above 50 indicates expansion
Exhibit 5: Exports and imports growth trends
Exhibit 6: Key policy rates
(%)
Exports yoy growth
Imports yoy growth
(%)
Repo rate
Reverse Repo rate
CRR
50.0
7.00
40.0
6.50
30.0
6.00
20.0
5.50
10.0
5.00
0.0
4.50
(10.0)
4.00
(20.0)
3.50
(30.0)
3.00
Source: Bloomberg, Angel Research
Source: RBI, Angel Research
Market Outlook
May 05, 2017
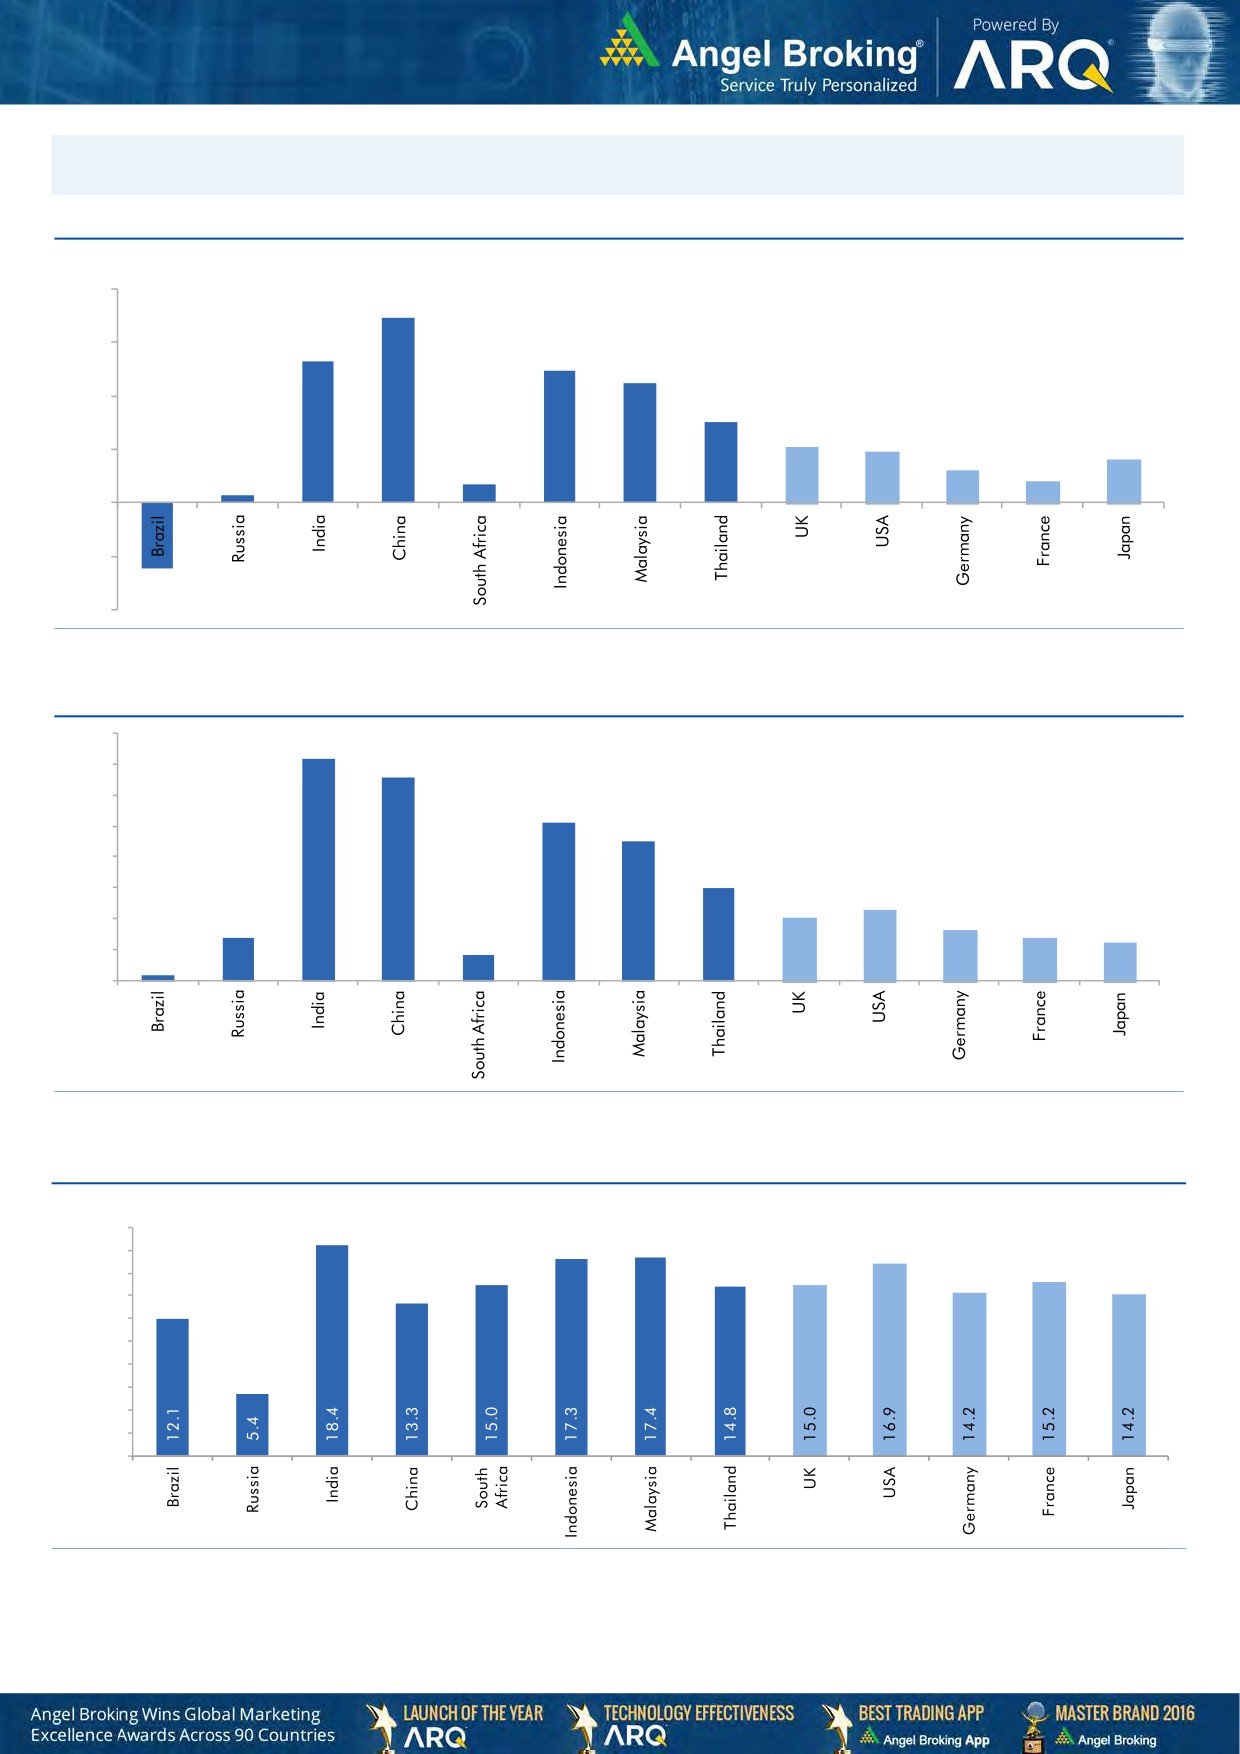
Global watch
Exhibit 1: Latest quarterly GDP Growth (%, yoy) across select developing and developed countries
(%)
8.0
6.9
6.0
5.3
4.9
0.7
4.5
4.0
3.0
2.1
1.9
2.0
0.3
1.6
1.2
0.8
-
(2.0)
(2.5)
(4.0)
Source: Bloomberg, Angel Research
Exhibit 2: 2016 GDP Growth projection by IMF (%, yoy) across select developing and developed countries
(%)
7.2
6.6
7.0
6.0
5.1
5.0
4.5
4.0
3.0
3.0
2.3
2.0
1.4
1.6
2.0
1.4
1.2
0.2
0.8
1.0
-
Source: IMF, Angel Research
Exhibit 3: One year forward P-E ratio across select developing and developed countries
(x)
20.0
18.0
16.0
14.0
12.0
10.0
8.0
6.0
4.0
2.0
-
Source: IMF, Angel Research
Market Outlook
May 05, 2017
Exhibit 4: Relative performance of indices across globe
Returns (%)
Country
Name of index
Closing price
1M
3M
1YR
Brazil
Bovespa
64,863
(0.6)
(1.8)
21.1
Russia
Micex
1,999
(0.5)
(9.9)
6.0
India
Nifty
9,360
2.0
8.3
19.2
China
Shanghai Composite
3,127
(3.5)
(1.3)
5.1
South Africa
Top 40
46,747
3.0
1.3
0.6
Mexico
Mexbol
48,998
0.3
3.3
8.5
Indonesia
LQ45
943
1.4
6.3
11.5
Malaysia
KLCI
1,759
0.8
5.2
3.9
Thailand
SET 50
999
0.1
0.3
11.2
USA
Dow Jones
20,951
1.5
5.3
18.6
UK
FTSE
7,248
(1.6)
2.1
18.3
Japan
Nikkei
19,446
2.8
2.1
10.7
Germany
DAX
12,648
3.2
9.6
25.9
France
CAC
5,372
5.6
13.1
25.1
Source: Bloomberg, Angel Research
Stock Watch
May 05, 2017
Company Name
Reco
CMP
Target
Mkt Cap
Sales ( Čcr )
OPM(%)
EPS (Č)
PER(x)
P/BV(x)
RoE(%)
EV/Sales(x)
(Č)
Price ( Č)
( Č cr )
FY17E
FY18E
FY17E
FY18E
FY17E
FY18E
FY17E
FY18E
FY17E
FY18E
FY17E
FY18E
FY17E
FY18E
6,577.0
6,907.0
Agri / Agri Chemical
Rallis
Neutral
239
-
4,644
1,937
2,164
13.3
14.3
9.0
11.0
26.5
21.7
4.6
4.0
18.4
19.8
2.4
2.1
United Phosphorus
Neutral
812
-
41,263
15,176
17,604
18.5
18.5
37.4
44.6
21.7
18.2
4.3
3.5
21.4
21.2
2.8
2.4
Auto & Auto Ancillary
Ashok Leyland
Buy
84
111
23,763
20,021
21,915
11.6
11.9
4.5
5.3
18.6
15.7
3.8
3.4
20.6
21.5
1.1
1.0
Bajaj Auto
Neutral
2,935
-
84,923
25,093
27,891
19.5
19.2
143.9
162.5
20.4
18.1
5.7
4.9
30.3
29.4
3.1
2.7
Bharat Forge
Neutral
1,120
-
26,068
7,726
8,713
20.5
21.2
35.3
42.7
31.7
26.2
5.9
5.3
18.9
20.1
3.4
3.0
Eicher Motors
Neutral
25,764
-
70,105
16,583
20,447
17.5
18.0
598.0
745.2
43.1
34.6
14.7
11.2
41.2
38.3
4.1
3.2
Gabriel India
Neutral
124
-
1,779
1,544
1,715
9.0
9.3
5.4
6.3
22.9
19.7
4.3
3.8
18.9
19.5
1.1
1.0
Hero Motocorp
Neutral
3,394
-
67,779
28,083
30,096
15.3
15.7
171.8
187.0
19.8
18.2
6.9
5.8
30.1
27.9
2.2
2.0
Jamna Auto Industries Neutral
235
-
1,871
1,486
1,620
9.8
9.9
15.0
17.2
15.7
13.7
3.4
2.9
21.8
21.3
1.3
1.2
L G Balakrishnan & Bros Neutral
639
-
1,003
1,302
1,432
11.6
11.9
43.7
53.0
14.6
12.1
2.1
1.9
13.8
14.2
0.9
0.8
Mahindra and Mahindra Neutral
1,335
-
82,931
46,534
53,077
11.6
11.7
67.3
78.1
19.8
17.1
3.2
2.8
15.4
15.8
1.8
1.5
Maruti
Neutral
6,637
-
200,489
67,822
83,288
16.0
16.4
253.8
312.4
26.2
21.3
6.0
4.9
23.0
22.9
2.6
2.1
Minda Industries
Neutral
485
-
4,194
2,728
3,042
9.0
9.1
68.2
86.2
7.1
5.6
1.6
1.3
23.8
24.3
1.6
1.4
Motherson Sumi
Neutral
403
-
56,606
45,896
53,687
7.8
8.3
13.0
16.1
30.9
25.1
10.0
8.0
34.7
35.4
1.3
1.1
Rane Brake Lining
Neutral
1,005
-
796
511
562
11.3
11.5
28.1
30.9
35.8
32.5
5.5
5.0
15.3
15.0
1.7
1.6
Setco Automotive
Neutral
42
-
559
741
837
13.0
13.0
15.2
17.0
2.8
2.5
0.5
0.4
15.8
16.3
1.1
1.0
Tata Motors
Neutral
437
-
126,033
300,209
338,549
8.9
8.4
42.7
54.3
10.2
8.1
1.6
1.4
15.6
17.2
0.5
0.5
TVS Motor
Neutral
497
-
23,609
13,390
15,948
6.9
7.1
12.8
16.5
38.9
30.0
9.7
7.7
26.3
27.2
1.8
1.5
Amara Raja Batteries
Accumulate
883
1,009
15,076
5,305
6,100
16.0
16.3
28.4
34.0
31.1
26.0
6.0
5.0
19.3
19.3
2.8
2.5
Exide Industries
Neutral
236
-
20,094
7,439
8,307
15.0
15.0
8.1
9.3
29.2
25.4
4.1
3.7
14.3
16.7
2.3
2.1
Apollo Tyres
Neutral
243
-
12,362
12,877
14,504
14.3
13.9
21.4
23.0
11.3
10.6
1.8
1.5
16.4
15.2
1.1
1.0
Ceat
Neutral
1,620
-
6,554
7,524
8,624
13.0
12.7
131.1
144.3
12.4
11.2
2.3
1.9
19.8
18.6
1.0
0.8
JK Tyres
Neutral
176
-
3,992
7,455
8,056
15.0
15.0
21.8
24.5
8.1
7.2
1.7
1.4
22.8
21.3
0.7
0.6
Swaraj Engines
Neutral
1,834
-
2,277
660
810
15.2
16.4
54.5
72.8
33.6
25.2
10.5
9.5
31.5
39.2
3.3
2.6
Subros
Neutral
253
-
1,516
1,488
1,681
11.7
11.9
6.4
7.2
39.5
35.3
4.2
3.8
10.8
11.4
1.3
1.1
Indag Rubber
Neutral
224
-
588
286
326
19.8
16.8
11.7
13.3
19.1
16.8
3.2
3.0
17.8
17.1
1.7
1.5
Capital Goods
ACE
Neutral
63
-
626
709
814
4.1
4.6
1.4
2.1
45.2
30.1
1.9
1.8
4.4
6.0
1.0
0.9
Stock Watch
May 05, 2017
Company Name
Reco
CMP
Target
Mkt Cap
Sales ( Čcr )
OPM(%)
EPS (Č)
PER(x)
P/BV(x)
RoE(%)
EV/Sales(x)
(Č)
Price ( Č)
( Č cr )
FY17E
FY18E
FY17E
FY18E
FY17E
FY18E
FY17E
FY18E
FY17E
FY18E
FY17E
FY18E
FY17E
FY18E
Capital Goods
BEML
Neutral
1,385
-
5,766
3,451
4,055
6.3
9.2
31.4
57.9
44.1
23.9
2.7
2.4
6.3
10.9
1.8
1.5
Bharat Electronics
Neutral
182
-
40,596
8,137
9,169
16.8
17.2
58.7
62.5
3.1
2.9
0.5
0.4
44.6
46.3
4.0
3.6
Voltas
Neutral
425
-
14,069
6,511
7,514
7.9
8.7
12.9
16.3
33.0
26.1
5.9
5.2
16.7
18.5
1.9
1.6
BGR Energy
Neutral
167
-
1,203
16,567
33,848
6.0
5.6
7.8
5.9
21.4
28.3
1.2
1.2
4.7
4.2
0.2
0.1
BHEL
Neutral
174
-
42,662
28,797
34,742
-
2.8
2.3
6.9
75.8
25.3
1.3
1.3
1.3
4.8
1.1
0.8
Blue Star
Accumulate
680
760
6,500
4,283
5,077
5.9
7.3
14.9
22.1
45.7
30.7
8.9
7.5
20.4
26.4
1.6
1.3
CG Power and Industrial
Neutral
78
-
4,867
5,777
6,120
5.9
7.0
3.3
4.5
23.5
17.3
1.0
1.0
4.4
5.9
0.8
0.7
Solutions
Greaves Cotton
Neutral
174
-
4,237
1,755
1,881
16.8
16.9
7.8
8.5
22.2
20.4
4.5
4.1
20.6
20.9
2.1
1.9
Inox Wind
Neutral
200
-
4,432
5,605
6,267
15.7
16.4
24.8
30.0
8.1
6.7
2.2
1.7
25.9
24.4
0.8
0.7
KEC International
Neutral
216
-
5,557
9,294
10,186
7.9
8.1
9.9
11.9
21.8
18.2
3.2
2.8
15.6
16.3
0.8
0.8
KEI Industries
Accumulate
215
239
1,675
2,682
3,058
10.4
10.0
11.7
12.8
18.4
16.8
3.7
3.1
20.1
18.2
0.8
0.7
Thermax
Neutral
1,035
-
12,336
5,421
5,940
7.3
7.3
25.7
30.2
40.3
34.3
4.9
4.5
12.2
13.1
2.2
2.0
VATech Wabag
Neutral
675
-
3,683
3,136
3,845
8.9
9.1
26.0
35.9
26.0
18.8
3.2
2.8
13.4
15.9
1.1
0.9
Cement
ACC
Neutral
1,624
-
30,493
11,225
13,172
13.2
16.9
44.5
75.5
36.5
21.5
3.5
3.2
11.2
14.2
2.7
2.3
Ambuja Cements
Neutral
244
-
48,489
9,350
10,979
18.2
22.5
5.8
9.5
42.1
25.7
3.5
3.2
10.2
12.5
5.2
4.4
India Cements
Neutral
214
-
6,558
4,364
4,997
18.5
19.2
7.9
11.3
27.0
18.9
1.9
1.9
8.0
8.5
2.3
2.0
JK Cement
Neutral
989
-
6,917
4,398
5,173
15.5
17.5
31.2
55.5
31.7
17.8
3.8
3.3
12.0
15.5
2.1
1.8
J K Lakshmi Cement
Neutral
490
-
5,769
2,913
3,412
14.5
19.5
7.5
22.5
65.4
21.8
4.0
3.4
12.5
18.0
2.6
2.1
Orient Cement
Neutral
167
-
3,411
2,114
2,558
18.5
20.5
8.1
11.3
20.6
14.7
3.0
2.6
9.0
14.0
2.2
1.8
UltraTech Cement
Neutral
4,320
-
118,597
25,768
30,385
21.0
23.5
111.0
160.0
38.9
27.0
5.0
4.3
13.5
15.8
4.7
3.9
Construction
ITNL
Neutral
115
-
3,776
8,946
10,017
31.0
31.6
8.1
9.1
14.2
12.6
0.5
0.5
4.2
5.0
3.8
3.5
KNR Constructions
Neutral
203
-
2,861
1,385
1,673
14.7
14.0
41.2
48.5
4.9
4.2
0.9
0.8
14.9
15.2
2.1
1.8
Larsen & Toubro
Neutral
1,732
-
161,652
111,017
124,908
11.0
11.0
61.1
66.7
28.4
26.0
3.4
3.2
13.1
12.9
2.5
2.3
Gujarat Pipavav Port
Neutral
162
-
7,810
705
788
52.2
51.7
5.0
5.6
32.3
28.9
3.2
2.9
11.2
11.2
10.7
9.1
Nagarjuna Const.
Neutral
98
-
5,429
8,842
9,775
9.1
8.8
5.3
6.4
18.4
15.3
1.5
1.3
8.2
9.1
0.8
0.7
PNC Infratech
Neutral
160
-
4,115
2,350
2,904
13.1
13.2
9.0
8.8
17.8
18.2
0.7
0.6
15.9
13.9
1.9
1.5
Simplex Infra
Neutral
417
-
2,062
6,829
7,954
10.5
10.5
31.4
37.4
13.3
11.1
1.4
1.3
9.9
13.4
0.7
0.6
Power Mech Projects
Neutral
581
-
854
1,801
2,219
12.7
14.6
72.1
113.9
8.1
5.1
1.5
1.3
16.8
11.9
0.5
0.4
Sadbhav Engineering
Neutral
326
-
5,601
3,598
4,140
10.3
10.6
9.0
11.9
36.3
27.4
3.8
3.3
9.9
11.9
1.8
1.6
Stock Watch
May 05, 2017
Company Name
Reco
CMP
Target
Mkt Cap
Sales ( Čcr )
OPM(%)
EPS (Č)
PER(x)
P/BV(x)
RoE(%)
EV/Sales(x)
(Č)
Price ( Č)
( Č cr )
FY17E
FY18E
FY17E
FY18E
FY17E
FY18E
FY17E
FY18E
FY17E
FY18E
FY17E
FY18E
FY17E
FY18E
Construction
NBCC
Neutral
199
-
17,919
7,428
9,549
7.9
8.6
8.2
11.0
24.3
18.1
1.2
1.0
28.2
28.7
2.1
1.6
MEP Infra
Neutral
69
-
1,114
1,877
1,943
30.6
29.8
3.0
4.2
22.9
16.3
11.1
7.5
0.6
0.6
2.0
1.8
SIPL
Neutral
101
-
3,573
1,036
1,252
65.5
66.2
(8.4)
(5.6)
3.8
4.3
(22.8)
(15.9)
11.7
9.7
Engineers India
Neutral
170
-
11,446
1,725
1,935
16.0
19.1
11.4
13.9
14.9
12.2
2.1
2.0
13.4
15.3
5.6
5.0
Financials
Axis Bank
Accumulate
519
580
124,346
46,932
53,575
3.5
3.4
32.4
44.6
16.0
11.6
2.1
1.8
13.6
16.5
-
-
Bank of Baroda
Neutral
196
-
45,115
19,980
23,178
1.8
1.8
11.5
17.3
17.0
11.3
2.0
1.6
8.3
10.1
-
-
Canara Bank
Neutral
389
-
23,238
15,225
16,836
1.8
1.8
14.5
28.0
26.8
13.9
1.9
1.5
5.8
8.5
-
-
Can Fin Homes
Neutral
2,841
-
7,563
420
526
3.5
3.5
86.5
107.8
32.9
26.4
7.1
5.8
23.6
24.1
-
-
Cholamandalam Inv. &
Accumulate
1,085
1,230
16,958
2,012
2,317
6.3
6.3
42.7
53.6
25.4
20.2
4.0
3.4
16.9
18.3
-
-
Fin. Co.
Dewan Housing Finance Buy
438
520
13,716
2,225
2,688
2.9
2.9
29.7
34.6
14.8
12.7
2.4
1.6
16.1
14.8
-
-
Equitas Holdings
Buy
164
235
5,525
939
1,281
11.7
11.5
5.8
8.2
28.2
20.0
2.4
2.2
10.9
11.5
-
-
Federal Bank
Accumulate
112
125
19,367
8,259
8,995
3.0
3.0
4.3
5.6
26.1
20.1
2.2
2.0
8.5
10.1
-
-
HDFC
Neutral
1,564
-
248,531
11,475
13,450
3.4
3.4
45.3
52.5
34.5
29.8
6.7
5.9
20.2
20.5
-
-
HDFC Bank
Accumulate
1,533
1,650
393,316
46,097
55,433
4.5
4.5
58.4
68.0
26.3
22.6
4.6
3.9
18.8
18.6
-
-
ICICI Bank
Accumulate
298
315
173,573
42,800
44,686
3.1
3.3
18.0
21.9
16.6
13.6
2.2
2.1
11.1
12.3
-
-
Karur Vysya Bank
Buy
120
140
7,255
5,640
6,030
3.3
3.2
8.9
10.0
13.5
12.0
1.4
1.3
11.2
11.4
-
-
Lakshmi Vilas Bank
Neutral
180
-
3,436
3,339
3,799
2.7
2.8
11.0
14.0
16.3
12.8
1.7
1.6
11.2
12.7
-
-
LIC Housing Finance
Neutral
717
-
36,162
3,712
4,293
2.6
2.5
39.0
46.0
18.4
15.6
3.5
2.9
19.9
20.1
-
-
Punjab Natl.Bank
Neutral
179
-
38,186
23,532
23,595
2.3
2.4
6.8
12.6
26.4
14.2
4.1
2.9
3.3
6.5
-
-
RBL Bank
Neutral
571
-
21,439
1,783
2,309
2.6
2.6
12.7
16.4
45.0
34.8
4.9
4.4
12.8
13.3
-
-
Repco Home Finance
Accumulate
748
825
4,677
388
457
4.5
4.2
30.0
38.0
24.9
19.7
4.2
3.5
18.0
19.2
-
-
South Ind.Bank
Neutral
26
-
4,669
6,435
7,578
2.5
2.5
2.7
3.1
9.6
8.4
1.2
1.0
10.1
11.2
-
-
St Bk of India
Neutral
299
-
242,323
88,650
98,335
2.6
2.6
13.5
18.8
22.1
15.9
2.1
1.8
7.0
8.5
-
-
Union Bank
Neutral
190
-
13,068
13,450
14,925
2.3
2.3
25.5
34.5
7.5
5.5
1.1
0.9
7.5
10.2
-
-
Yes Bank
Neutral
1,628
-
74,355
8,978
11,281
3.3
3.4
74.0
90.0
22.0
18.1
4.2
3.5
17.0
17.2
-
-
FMCG
Akzo Nobel India
Neutral
2,002
-
9,603
2,955
3,309
13.3
13.7
57.2
69.3
35.0
28.9
11.4
9.6
32.7
33.3
3.0
2.7
Asian Paints
Neutral
1,130
-
108,423
17,128
18,978
16.8
16.4
19.1
20.7
59.2
54.6
20.6
19.4
34.8
35.5
6.2
5.6
Britannia
Neutral
3,583
-
43,000
9,594
11,011
14.6
14.9
80.3
94.0
44.6
38.1
18.4
14.2
41.2
-
4.3
3.7
Colgate
Neutral
1,044
-
28,390
4,605
5,149
23.4
23.4
23.8
26.9
43.9
38.8
24.3
19.0
64.8
66.8
6.1
5.4
Stock Watch
May 05, 2017
Company Name
Reco
CMP
Target
Mkt Cap
Sales ( Čcr )
OPM(%)
EPS (Č)
PER(x)
P/BV(x)
RoE(%)
EV/Sales(x)
(Č)
Price ( Č)
( Č cr )
FY17E FY18E
FY17E
FY18E
FY17E
FY18E
FY17E
FY18E
FY17E
FY18E
FY17E
FY18E
FY17E
FY18E
FMCG
Dabur India
Accumulate
277
304
48,803
8,315
9,405
19.8
20.7
8.1
9.2
34.2
30.1
9.5
7.9
31.6
31.0
5.5
4.9
GlaxoSmith Con*
Neutral
5,122
-
21,541
4,350
4,823
21.2
21.4
179.2
196.5
28.6
26.1
7.6
6.4
27.1
26.8
4.3
3.8
Godrej Consumer
Neutral
1,810
-
61,642
10,235
11,428
18.4
18.6
41.1
44.2
44.0
41.0
9.8
8.2
24.9
24.8
6.1
5.4
HUL
Neutral
956
-
206,944
35,252
38,495
17.8
17.8
20.7
22.4
46.3
42.7
44.3
38.0
95.6
88.9
5.7
5.2
ITC
Neutral
281
-
341,463
40,059
44,439
38.3
39.2
9.0
10.1
31.3
27.7
8.7
7.6
27.8
27.5
8.0
7.2
Marico
Neutral
310
-
39,992
6,430
7,349
18.8
19.5
6.4
7.7
48.4
40.3
14.6
12.3
33.2
32.5
6.0
5.2
Nestle*
Neutral
6,731
-
64,894
10,073
11,807
20.7
21.5
124.8
154.2
53.9
43.7
22.1
19.9
34.8
36.7
6.3
5.3
Tata Global
Neutral
155
-
9,805
8,675
9,088
9.8
9.8
7.4
8.2
21.0
19.0
1.7
1.6
7.9
8.1
1.0
1.0
Procter & Gamble
Neutral
7,399
-
24,019
2,939
3,342
23.2
23.0
146.2
163.7
50.6
45.2
12.8
10.6
25.3
23.5
7.7
6.7
Hygiene
IT
HCL Tech^
Buy
821
1,000
117,212
49,242
57,168
20.5
20.5
55.7
64.1
14.8
12.8
3.0
2.3
20.3
17.9
2.2
1.8
Infosys
Buy
936
1,179
215,063
68,484
73,963
26.0
26.0
63.0
64.0
14.9
14.6
3.1
2.9
20.8
19.7
2.8
2.5
TCS
Accumulate
2,327
2,651
458,538
117,966
127,403
27.5
27.6
134.3
144.5
17.3
16.1
5.2
4.8
29.8
29.7
3.5
3.3
Tech Mahindra
Buy
419
600
40,788
29,673
32,937
15.5
17.0
32.8
39.9
12.8
10.5
2.5
2.2
19.6
20.7
1.1
0.9
Wipro
Accumulate
499
570
121,320
55,421
58,536
20.3
20.3
35.1
36.5
14.2
13.7
2.5
2.1
19.2
14.6
1.6
1.4
Media
D B Corp
Neutral
370
-
6,803
2,297
2,590
27.4
28.2
21.0
23.4
17.6
15.8
4.1
3.6
23.7
23.1
2.8
2.4
HT Media
Neutral
83
-
1,926
2,693
2,991
12.6
12.9
7.9
9.0
10.5
9.2
0.9
0.8
7.8
8.3
0.3
0.2
Jagran Prakashan
Buy
193
225
6,311
2,355
2,635
28.0
28.0
10.8
12.5
17.9
15.5
3.9
3.4
21.7
21.7
2.7
2.4
Sun TV Network
Neutral
890
-
35,068
2,850
3,265
70.1
71.0
26.2
30.4
34.0
29.3
8.7
7.7
24.3
25.6
11.9
10.3
Hindustan Media
Neutral
286
-
2,100
1,016
1,138
24.3
25.2
27.3
30.1
10.5
9.5
2.0
1.8
16.2
15.8
1.4
1.2
Ventures
TV Today Network
Buy
264
344
1,573
567
645
26.7
27.0
15.4
18.1
17.2
14.6
2.6
2.2
14.9
15.2
2.3
2.0
Metals & Mining
Coal India
Neutral
280
-
173,714
84,638
94,297
21.4
22.3
24.5
27.1
11.4
10.3
4.8
4.5
42.6
46.0
1.6
1.4
Hind. Zinc
Neutral
261
-
110,239
14,252
18,465
55.9
48.3
15.8
21.5
16.5
12.1
2.7
2.4
17.0
20.7
7.7
6.0
Hindalco
Neutral
192
-
43,161
107,899
112,095
7.4
8.2
9.2
13.0
20.9
14.8
1.0
1.0
4.8
6.6
0.9
0.9
JSW Steel
Neutral
194
-
46,930
53,201
58,779
16.1
16.2
130.6
153.7
1.5
1.3
0.2
0.2
14.0
14.4
1.6
1.4
NMDC
Neutral
128
-
40,529
6,643
7,284
44.4
47.7
7.1
7.7
18.0
16.6
1.6
1.5
8.8
9.2
3.9
3.5
SAIL
Neutral
62
-
25,441
47,528
53,738
(0.7)
2.1
(1.9)
2.6
23.7
0.7
0.6
(1.6)
3.9
1.4
1.3
Vedanta
Neutral
233
-
68,929
71,744
81,944
19.2
21.7
13.4
20.1
17.4
11.6
1.5
1.3
8.4
11.3
1.4
1.0
Tata Steel
Neutral
443
-
42,991
121,374
121,856
7.2
8.4
18.6
34.3
23.8
12.9
1.5
1.4
6.1
10.1
1.0
1.0
Oil & Gas
Cairn India
#VALUE!
9,127
10,632
4.3
20.6
8.8
11.7
3.3
4.2
Stock Watch
May 05, 2017
Company Name
Reco
CMP
Target
Mkt Cap
Sales ( Čcr )
OPM(%)
EPS (Č)
PER(x)
P/BV(x)
RoE(%)
EV/Sales(x)
(Č)
Price ( Č)
( Č cr )
FY17E FY18E
FY17E
FY18E
FY17E
FY18E
FY17E
FY18E
FY17E
FY18E
FY17E
FY18E
FY17E
FY18E
Oil & Gas
GAIL
Neutral
428
-
72,362
56,220
65,198
9.3
10.1
27.1
33.3
15.8
12.9
1.4
1.3
9.3
10.7
1.5
1.2
ONGC
Neutral
189
-
242,227
137,222
152,563
15.0
21.8
19.5
24.1
9.7
7.8
0.8
0.8
8.5
10.1
2.0
1.8
Indian Oil Corp
Neutral
436
-
211,548
373,359
428,656
5.9
5.5
54.0
59.3
8.1
7.4
1.3
1.1
16.0
15.6
0.7
0.6
Reliance Industries
Neutral
1,359
-
441,775
301,963
358,039
12.1
12.6
87.7
101.7
15.5
13.4
1.6
1.4
10.7
11.3
1.9
1.6
Pharmaceuticals
Alembic Pharma
Accumulate
600
689
11,304
3,483
4,244
20.2
21.4
24.3
33.6
24.7
17.9
5.6
4.5
25.5
25.3
3.2
2.5
Alkem Laboratories Ltd
Accumulate
1,963
2,257
23,466
6,065
7,009
18.7
20.0
80.2
92.0
24.5
21.3
5.5
4.6
22.5
21.6
3.8
3.3
Aurobindo Pharma
Buy
592
877
34,702
15,720
18,078
23.7
23.7
41.4
47.3
14.3
12.5
3.7
2.9
29.6
26.1
2.4
2.1
Aventis*
Neutral
4,233
-
9,748
2,277
2,597
16.6
17.4
128.9
157.0
32.8
27.0
5.6
4.3
21.6
26.4
4.1
3.4
Cadila Healthcare
Neutral
457
-
46,739
10,429
12,318
17.7
21.6
13.1
19.2
34.9
23.8
7.3
5.8
22.8
27.1
4.5
3.7
Cipla
Sell
550
465
44,220
15,378
18,089
15.7
16.8
19.3
24.5
28.5
22.4
3.3
2.9
12.3
13.9
3.0
2.5
Dr Reddy's
Neutral
2,606
-
43,176
16,043
18,119
18.0
23.0
78.6
130.9
33.2
19.9
3.2
2.9
10.1
15.2
2.5
2.4
Dishman Pharma
Sell
308
143
4,967
1,718
1,890
22.7
22.8
9.5
11.3
32.4
27.2
3.1
2.8
10.1
10.9
3.4
3.0
GSK Pharma*
Neutral
2,460
-
20,833
2,800
3,290
10.2
20.6
32.2
60.3
76.4
40.8
14.1
14.0
17.2
34.5
7.2
6.2
Indoco Remedies
Accumulate
224
240
2,060
1,112
1,289
16.2
18.2
11.6
16.0
19.3
14.0
3.1
2.6
17.0
20.1
2.0
1.6
Ipca labs
Accumulate
546
613
6,888
3,258
3,747
12.8
15.3
12.1
19.2
45.1
28.4
2.8
2.6
6.4
9.5
2.2
2.0
Lupin
Buy
1,264
1,809
57,064
15,912
18,644
26.4
26.7
58.1
69.3
21.8
18.2
4.2
3.5
21.4
20.9
3.7
3.0
Natco Pharma
Accumulate
892
974
15,546
2,090
2,335
32.1
26.6
26.8
23.2
33.2
38.5
9.4
8.1
28.4
21.1
7.5
92.1
Sun Pharma
Buy
632
847
151,571
31,129
35,258
32.0
32.9
30.2
35.3
20.9
17.9
3.4
2.8
20.0
20.1
4.4
3.7
Power
Tata Power
Neutral
83
-
22,450
36,916
39,557
17.4
27.1
5.1
6.3
16.3
13.2
1.4
1.3
9.0
10.3
1.6
1.5
NTPC
Neutral
162
-
133,783
86,605
95,545
17.5
20.8
11.8
13.4
13.8
12.1
1.4
1.3
10.5
11.1
2.9
2.9
Power Grid
Accumulate
210
223
110,099
25,315
29,193
88.2
88.7
14.2
17.2
14.9
12.3
2.3
2.0
15.2
16.1
9.0
8.1
Real Estate
Prestige Estate
Neutral
250
-
9,356
4,707
5,105
25.2
26.0
10.3
13.0
24.2
19.2
1.9
1.8
10.3
10.2
3.2
2.8
MLIFE
Accumulate
481
522
1,976
1,152
1,300
22.7
24.6
29.9
35.8
16.1
13.4
1.2
1.1
7.6
8.6
2.4
2.0
Telecom
Bharti Airtel
Neutral
346
-
138,270
105,086
114,808
34.5
34.7
12.2
16.4
28.4
21.1
1.9
1.8
6.8
8.4
2.2
1.9
Idea Cellular
Neutral
83
-
30,036
40,133
43,731
37.2
37.1
6.4
6.5
13.0
12.8
1.1
1.0
8.2
7.6
1.8
1.5
zOthers
Abbott India
Neutral
4,164
-
8,847
3,153
3,583
14.1
14.4
152.2
182.7
27.4
22.8
134.3
114.7
25.6
26.1
2.5
2.2
Asian Granito
Accumulate
383
405
1,152
1,060
1,169
12.2
12.5
12.7
15.9
30.2
24.1
2.9
2.6
9.5
10.7
1.4
1.2
Bajaj Electricals
Accumulate
351
395
3,554
4,801
5,351
5.7
6.2
10.4
13.7
33.7
25.6
4.2
3.7
12.4
14.5
0.7
0.7
Banco Products (India)
Neutral
237
-
1,691
1,353
1,471
12.3
12.4
14.5
16.3
16.3
14.5
22.5
20.3
14.5
14.6
1.2
128.1
Stock Watch
May 05, 2017
Company Name
Reco
CMP
Target
Mkt Cap
Sales ( Čcr )
OPM(%)
EPS (Č)
PER(x)
P/BV(x)
RoE(%)
EV/Sales(x)
(Č)
Price ( Č)
( Č cr )
FY17E
FY18E
FY17E
FY18E
FY17E
FY18E
FY17E
FY18E
FY17E
FY18E
FY17E
FY18E
FY17E
FY18E
zOthers
Coffee Day Enterprises
Neutral
252
-
5,193
2,964
3,260
20.5
21.2
4.7
8.0
-
31.5
2.9
2.7
5.5
8.5
2.2
1.9
Ltd
Competent Automobiles Neutral
228
-
146
1,137
1,256
3.1
2.7
28.0
23.6
8.2
9.7
43.9
39.7
14.3
11.5
0.1
0.1
Elecon Engineering
Neutral
62
-
696
1,482
1,660
13.7
14.5
3.9
5.8
15.9
10.7
3.7
3.4
7.8
10.9
0.8
0.7
Finolex Cables
Neutral
528
-
8,071
2,883
3,115
12.0
12.1
14.2
18.6
37.2
28.4
19.8
17.3
15.8
14.6
2.5
2.3
Garware Wall Ropes
Neutral
803
-
1,756
863
928
15.1
15.2
36.4
39.4
22.1
20.4
4.0
3.4
17.5
15.9
1.9
1.8
Goodyear India*
Neutral
875
-
2,019
1,598
1,704
10.4
10.2
49.4
52.6
17.7
16.6
81.8
71.8
18.2
17.0
0.9
135.2
Hitachi
Neutral
1,779
-
4,838
2,081
2,433
8.8
8.9
33.4
39.9
53.3
44.6
43.0
35.8
22.1
21.4
2.3
2.0
HSIL
Neutral
347
-
2,507
2,384
2,515
15.8
16.3
15.3
19.4
22.7
17.9
22.5
19.4
7.8
9.3
1.2
1.1
Interglobe Aviation
Neutral
1,107
-
39,996
21,122
26,005
14.5
27.6
110.7
132.1
10.0
8.4
59.8
42.7
168.5
201.1
1.9
1.5
Jyothy Laboratories
Neutral
381
-
6,922
1,440
2,052
11.5
13.0
8.5
10.0
44.8
38.1
10.9
10.1
18.6
19.3
5.1
3.5
Kirloskar Engines India
Neutral
401
-
5,796
2,554
2,800
9.9
10.0
10.5
12.1
38.2
33.1
16.0
15.1
10.7
11.7
1.9
1.7
Ltd
Linc Pen & Plastics
Neutral
286
-
424
382
420
9.3
9.5
13.5
15.7
21.3
18.2
3.6
3.2
17.1
17.3
1.2
1.1
M M Forgings
Neutral
628
-
758
546
608
20.4
20.7
41.3
48.7
15.2
12.9
86.0
76.1
16.6
17.0
1.2
1.1
Manpasand Bever.
Neutral
689
-
3,943
836
1,087
19.6
19.4
16.9
23.8
40.8
28.9
4.9
4.3
12.0
14.8
4.5
3.3
Mirza International
Neutral
116
-
1,397
963
1,069
17.2
18.0
6.1
7.5
18.9
15.5
2.9
2.5
15.0
15.7
1.7
1.5
MT Educare
Neutral
86
-
341
366
417
17.7
18.2
9.4
10.8
9.1
7.9
2.0
1.8
22.2
22.3
0.8
0.7
Narayana Hrudaya
Neutral
314
-
6,413
1,873
2,166
11.5
11.7
2.6
4.0
118.6
79.2
7.3
6.6
6.1
8.3
3.5
3.0
Navkar Corporation
Buy
214
265
3,050
369
561
42.9
42.3
6.9
11.5
31.0
18.6
2.2
2.0
7.4
10.5
9.3
6.1
Navneet Education
Neutral
169
-
3,947
1,062
1,147
24.0
24.0
6.1
6.6
27.7
25.5
5.7
5.1
20.6
19.8
3.8
3.5
Nilkamal
Neutral
2,196
-
3,277
1,995
2,165
10.7
10.4
69.8
80.6
31.5
27.3
125.5
109.0
16.6
16.5
1.6
1.5
Page Industries
Neutral
14,426
-
16,090
2,450
3,124
20.1
17.6
299.0
310.0
48.3
46.5
321.3
245.3
47.1
87.5
6.6
5.2
Parag Milk Foods
Neutral
237
-
1,993
1,919
2,231
9.3
9.6
9.5
12.9
25.1
18.3
3.9
3.2
15.5
17.5
1.2
1.0
Quick Heal
Neutral
245
-
1,718
408
495
27.3
27.0
7.7
8.8
31.7
27.9
2.9
2.9
9.3
10.6
3.4
2.8
Radico Khaitan
Buy
122
147
1,622
1,667
1,824
13.0
13.2
6.7
8.2
18.3
14.9
1.7
1.5
9.0
10.2
1.4
1.2
Relaxo Footwears
Neutral
489
-
5,874
2,085
2,469
9.2
8.2
7.6
8.0
64.7
61.5
25.1
21.4
17.9
18.8
2.9
2.5
S H Kelkar & Co.
Neutral
322
-
4,660
1,036
1,160
15.1
15.0
6.1
7.2
52.8
44.9
5.6
5.2
10.7
11.5
4.4
3.9
Siyaram Silk Mills
Accumulate
1,720
1,872
1,612
1,652
1,857
11.6
11.7
92.4
110.1
18.6
15.6
2.7
2.4
14.7
15.2
1.2
1.1
Styrolution ABS India*
Neutral
725
-
1,276
1,440
1,537
9.2
9.0
40.6
42.6
17.9
17.0
45.6
41.5
12.3
11.6
0.8
0.7
Surya Roshni
Neutral
290
-
1,271
3,342
3,625
7.8
7.5
17.3
19.8
16.8
14.7
31.9
25.6
10.5
10.8
0.6
0.6
Stock Watch
May 05, 2017
Company Name
Reco
CMP
Target Mkt Cap
Sales ( Čcr )
OPM(%)
EPS (Č)
PER(x)
P/BV(x)
RoE(%)
EV/Sales(x)
(Č)
Price ( Č)
( Č cr )
FY17E FY18E FY17E FY18E FY17E FY18E FY17E FY18E FY17E FY18E FY17E FY18E FY17E FY18E
zOthers
Team Lease Serv.
Neutral
1,093
-
1,869
3,229
4,001
1.5
1.8
22.8
32.8
48.0
33.3
5.1
4.5
10.7
13.4
0.5
0.4
The Byke Hospitality
Neutral
211
-
847
287
384
20.5
20.5
7.6
10.7
27.8
19.7
5.8
4.7
20.7
23.5
3.0
2.2
Transport Corporation of
Neutral
261
-
2,001
2,671
2,911
8.5
8.8
13.9
15.7
18.9
16.7
2.6
2.3
13.7
13.8
0.9
0.8
India
TVS Srichakra
Neutral
4,067
-
3,114
2,304
2,614
13.7
13.8
231.1
266.6
17.6
15.3
456.9
359.8
33.9
29.3
1.4
1.2
UFO Moviez
Neutral
447
-
1,233
619
685
33.2
33.4
30.0
34.9
14.9
12.8
2.1
1.8
13.8
13.9
1.7
1.4
Visaka Industries
Neutral
346
-
549
1,051
1,138
10.3
10.4
21.0
23.1
16.5
15.0
44.4
41.5
9.0
9.2
0.8
0.7
VRL Logistics
Neutral
336
-
3,068
1,902
2,119
16.7
16.6
14.6
16.8
23.1
20.0
5.1
4.4
21.9
22.2
1.7
1.5
VIP Industries
Accumulate
207
218
2,920
1,270
1,450
10.4
10.4
5.6
6.5
36.9
31.8
7.7
6.7
20.7
21.1
2.3
2.0
Navin Fluorine
Buy
3,073
3,650
3,009
789
945
21.1
22.4
120.1
143.4
25.6
21.4
4.1
3.5
17.8
18.5
3.7
3.1
Source: Company, Angel Research; Note: *December year end; #September year end; &October year end; Price as on May 04, 2017
Market Outlook
May 05, 2017
Research Team Tel: 022 - 39357800
DISCLAIMER
Angel Broking Private Limited (hereinafter referred to as “Angel”) is a registered Member of National Stock Exchange of India
Limited,Bombay Stock Exchange Limited and Metropolitan Stock Exchange Limited. It is also registered as a Depository Participant with
CDSL and Portfolio Manager with SEBI. It also has registration with AMFI as a Mutual Fund Distributor. Angel Broking Private Limited is a
registered entity with SEBI for Research Analyst in terms of SEBI (Research Analyst) Regulations, 2014 vide registration number
INH000000164. Angel or its associates has not been debarred/ suspended by SEBI or any other regulatory authority for accessing
/dealing in securities Market. Angel or its associates/analyst has not received any compensation / managed or
co-managed public offering of securities of the company covered by Analyst during the past twelve months.
This document is solely for the personal information of the recipient, and must not be singularly used as the basis of any investment
decision. Nothing in this document should be construed as investment or financial advice. Each recipient of this document should make
such investigations as they deem necessary to arrive at an independent evaluation of an investment in the securities of the companies
referred to in this document (including the merits and risks involved), and should consult their own advisors to determine the merits and
risks of such an investment.
Reports based on technical and derivative analysis center on studying charts of a stock's price movement, outstanding positions and
trading volume, as opposed to focusing on a company's fundamentals and, as such, may not match with a report on a company's
fundamentals. Investors are advised to refer the Fundamental and Technical Research Reports available on our website to evaluate the
contrary view, if any.
The information in this document has been printed on the basis of publicly available information, internal data and other reliable
sources believed to be true, but we do not represent that it is accurate or complete and it should not be relied on as such, as this
document is for general guidance only. Angel Broking Pvt. Limited or any of its affiliates/ group companies shall not be in any way
responsible for any loss or damage that may arise to any person from any inadvertent error in the information contained in this report.
Angel Broking Pvt. Limited has not independently verified all the information contained within this document. Accordingly, we cannot
testify, nor make any representation or warranty, express or implied, to the accuracy, contents or data contained within this document.
While Angel Broking Pvt. Limited endeavors to update on a reasonable basis the information discussed in this material, there may be
regulatory, compliance, or other reasons that prevent us from doing so.
This document is being supplied to you solely for your information, and its contents, information or data may not be reproduced,
redistributed or passed on, directly or indirectly.
Neither Angel Broking Pvt. Limited, nor its directors, employees or affiliates shall be liable for any loss or damage that may arise from
or in connection with the use of this information.